Examples for using `theme_mengbo` when generating ggplots
Mengbo Li
Bioinformatics Division, WEHI2025-10-06
ggthemeML.RmdColour palettes
Available Colour palettes so far:
names(ggthemeML:::mengbo_palettes)
 [1] "main"             "cool"             "hot"              "pastel"           "light"
 [6] "grey"             "opposite"         "opposite_ordinal" "wehi_full"        "wehi_light"
[11] "wehi_dark"        "wehi_mix"
show_col(mengbo_pal("main")(8))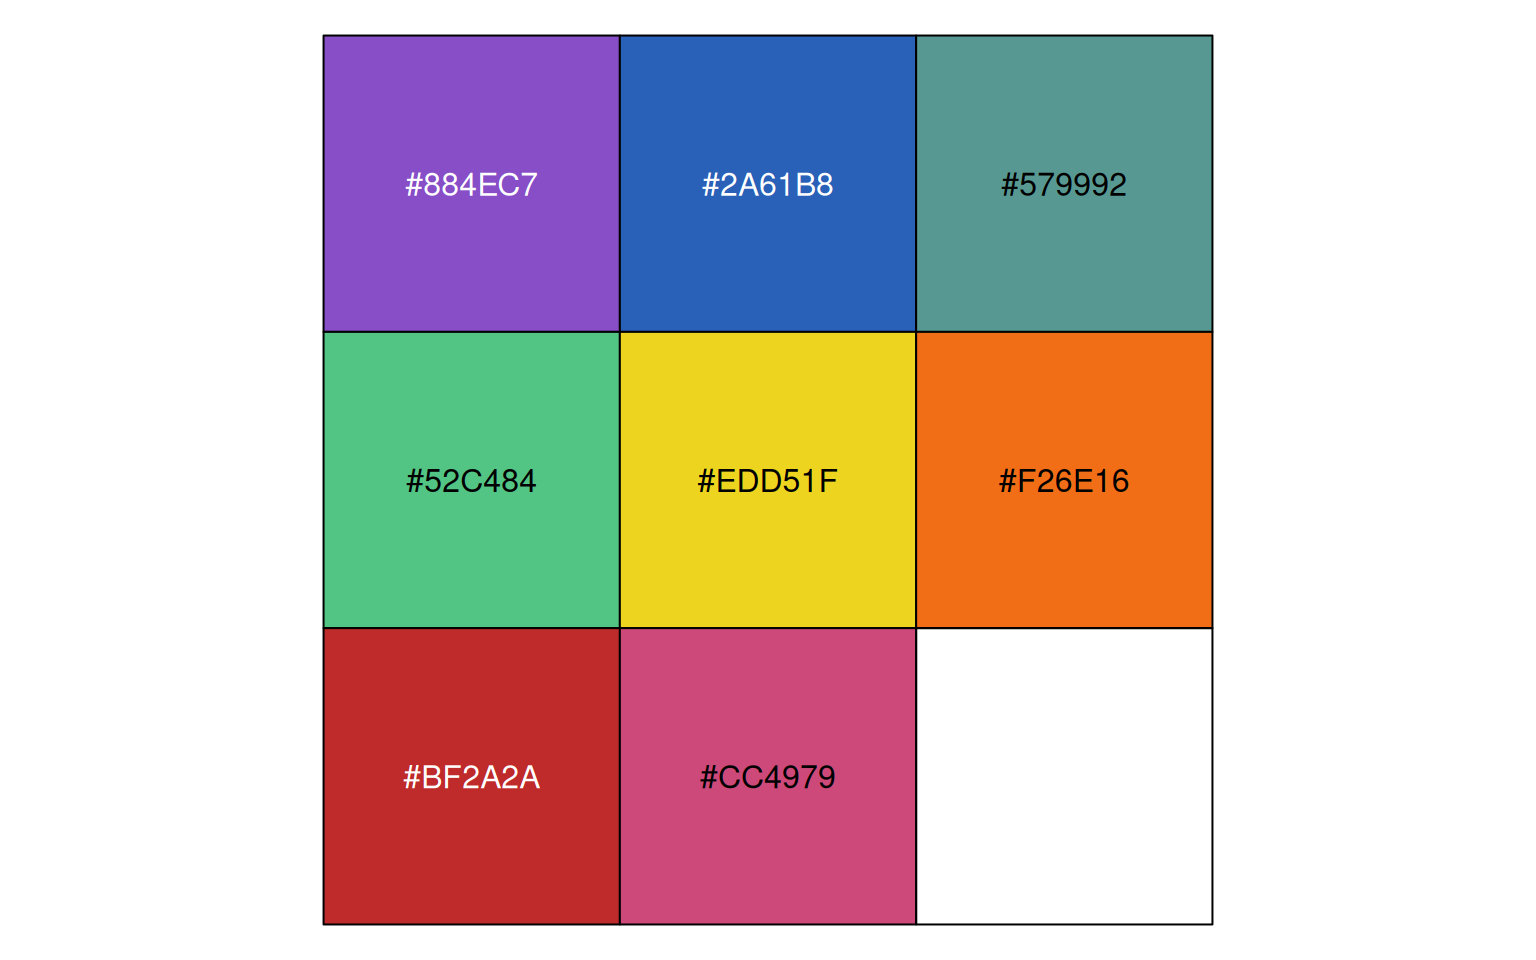
show_col(mengbo_pal("cool")(4))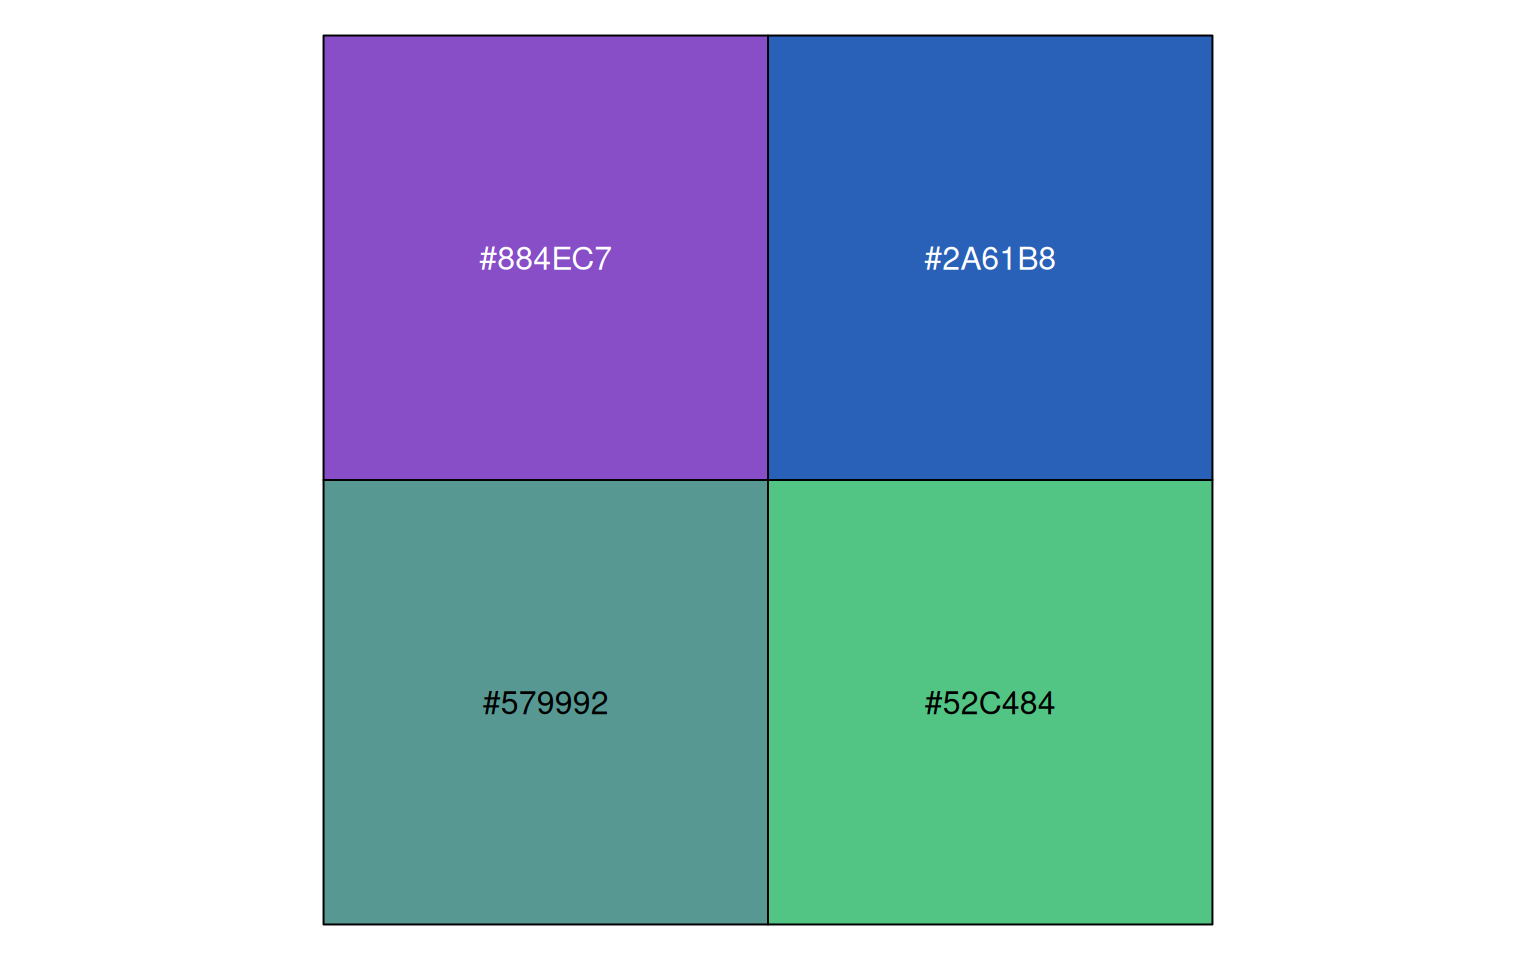
show_col(mengbo_pal("hot")(4))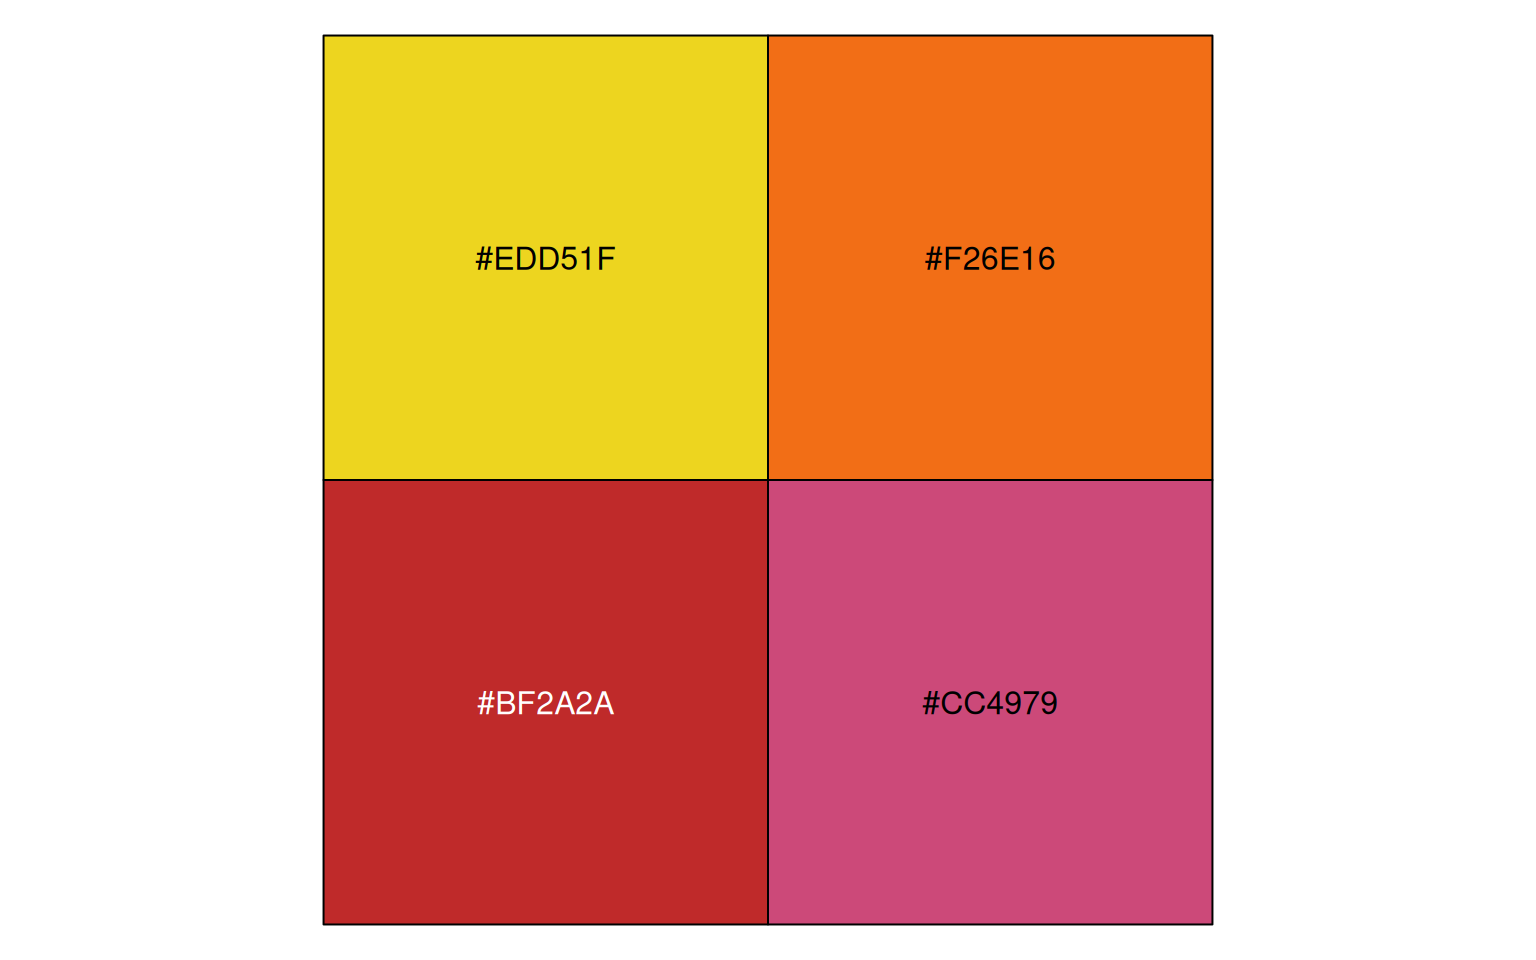
show_col(mengbo_pal("pastel")(8))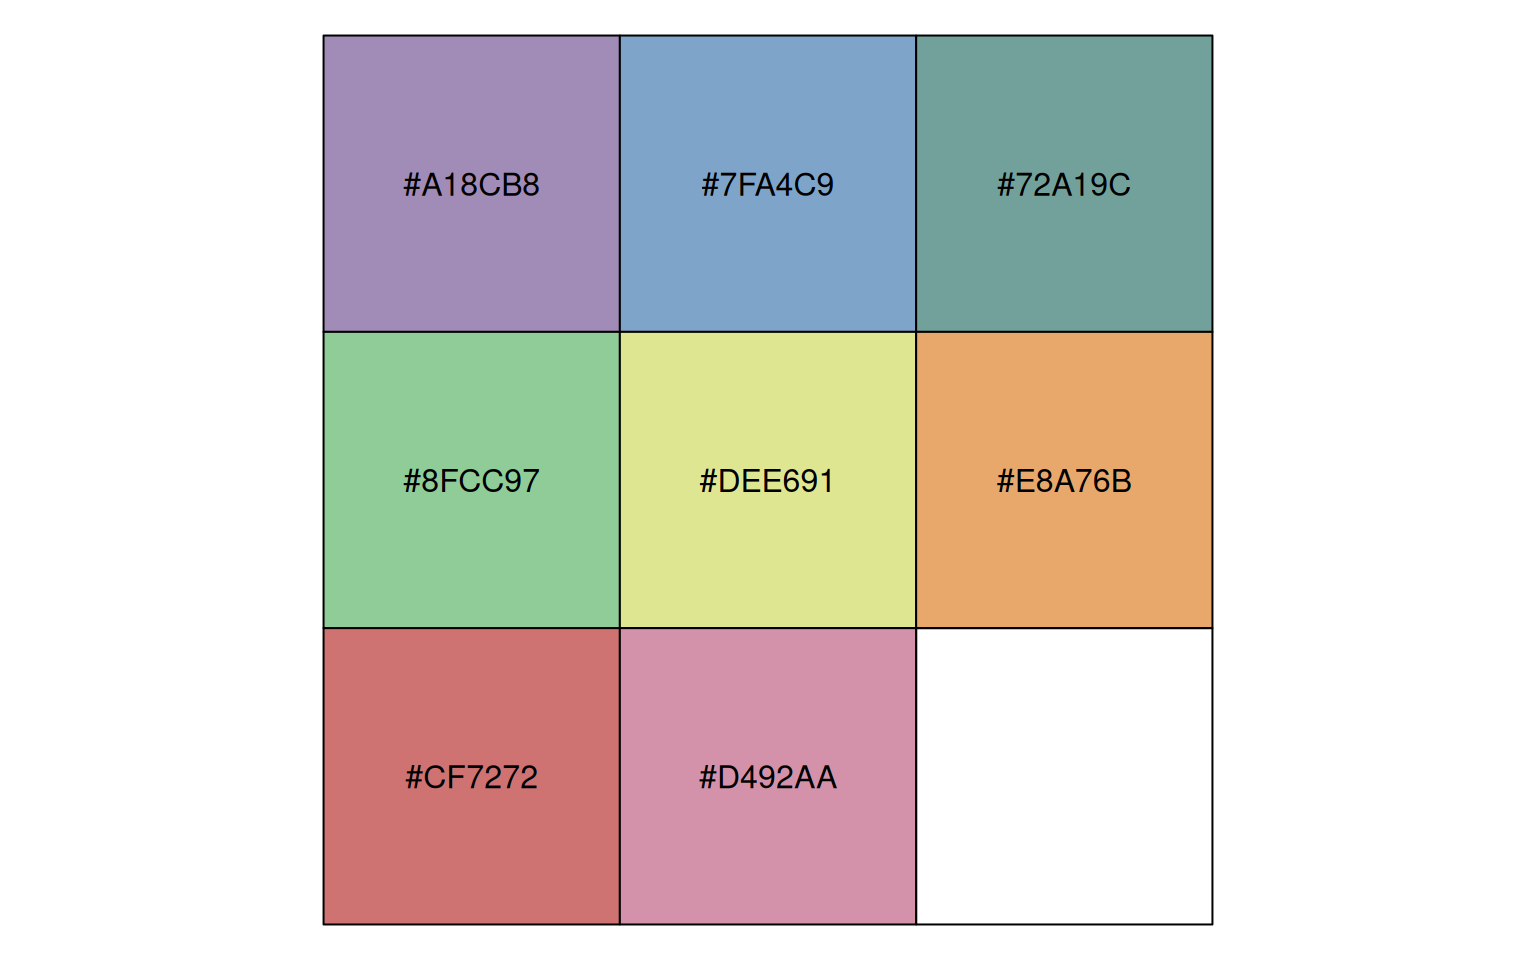
show_col(mengbo_pal("light")(8))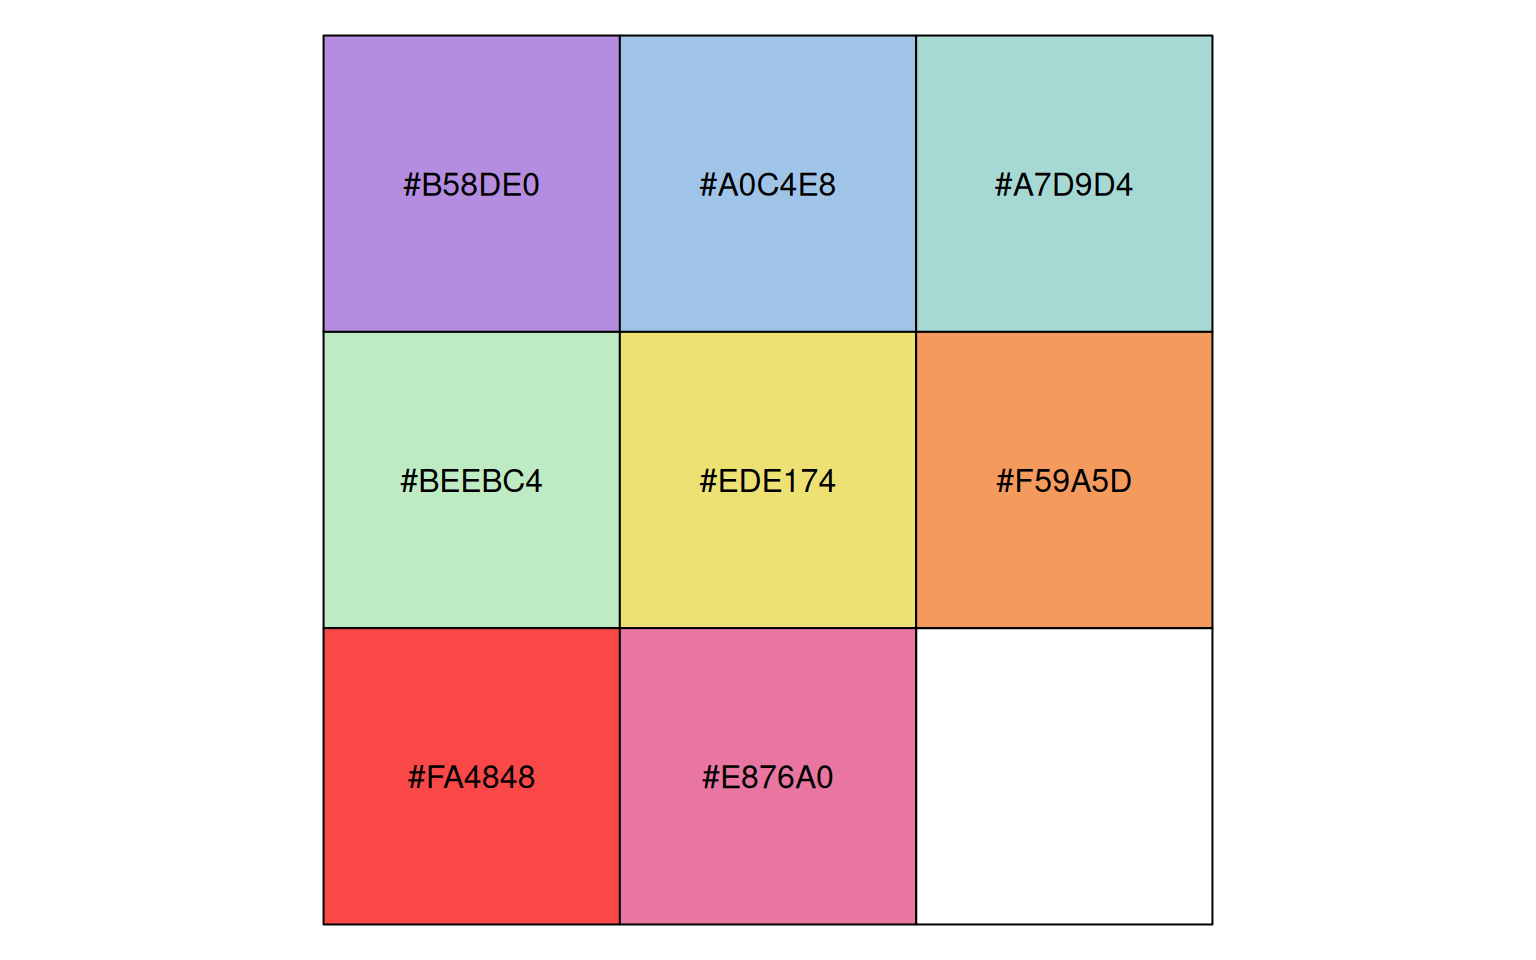
show_col(mengbo_pal("grey")(5))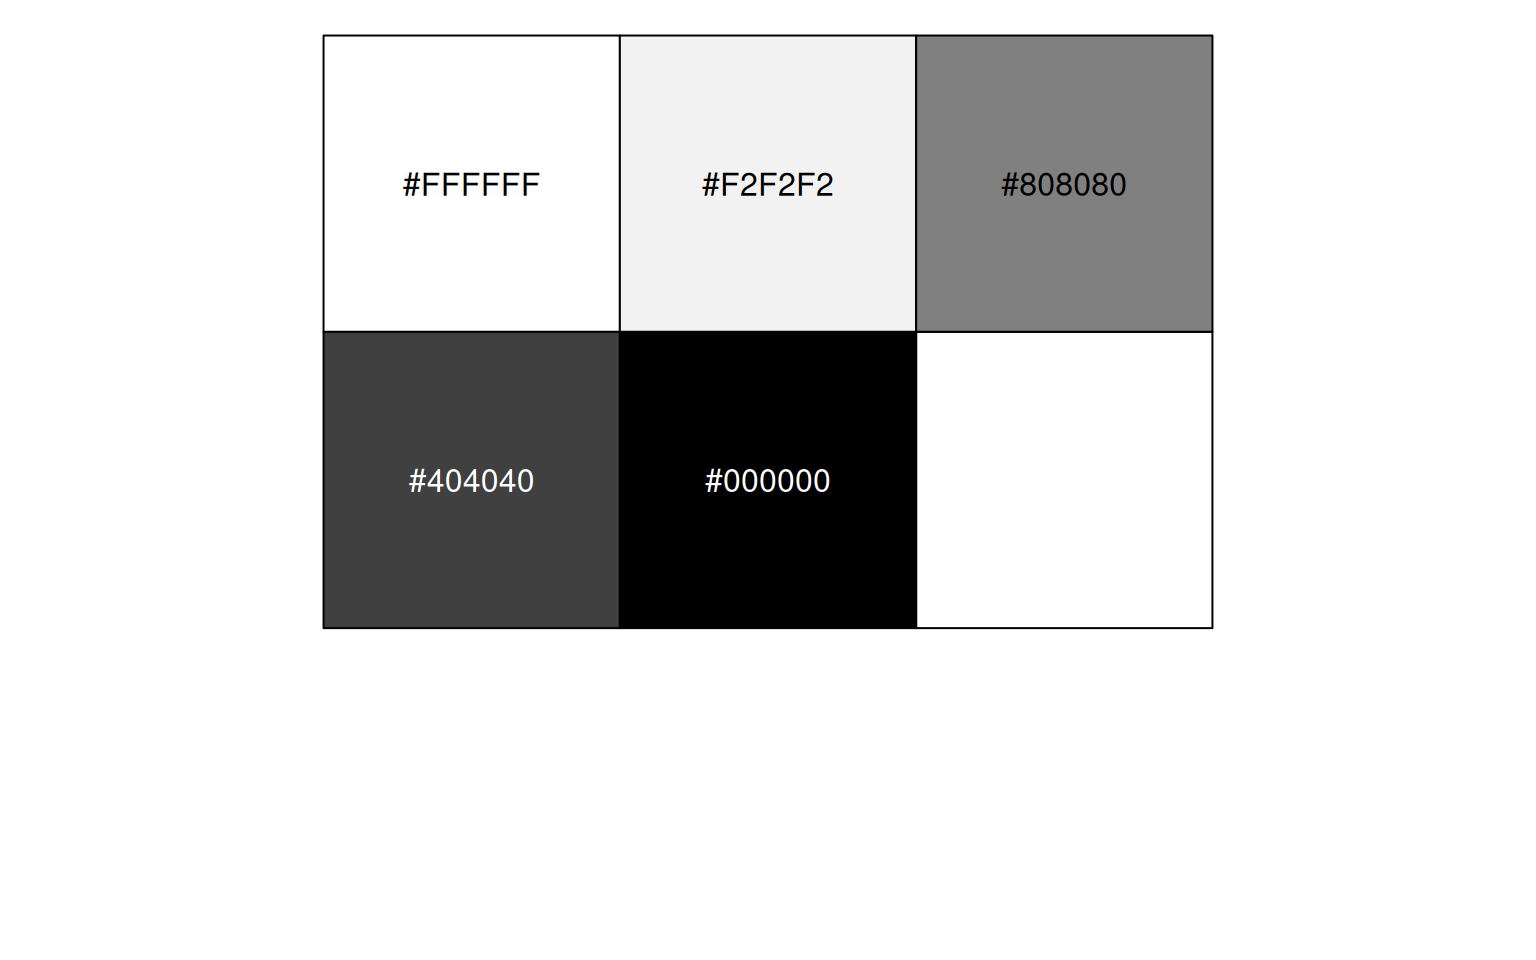
show_col(mengbo_pal("opposite")(6))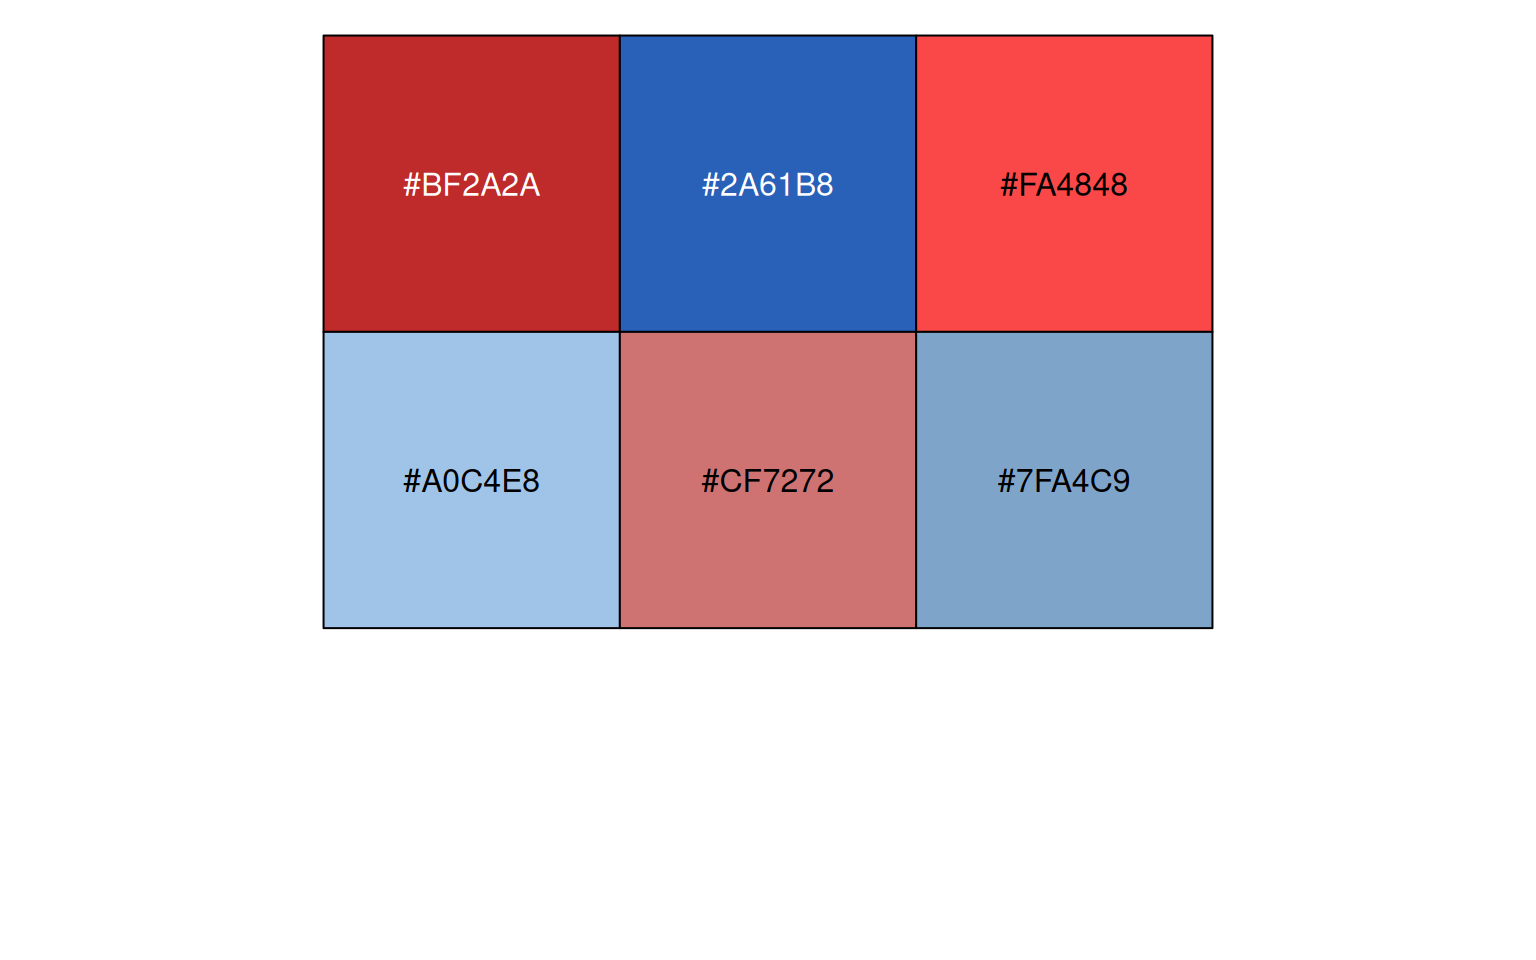
show_col(mengbo_pal("opposite_ordinal")(6))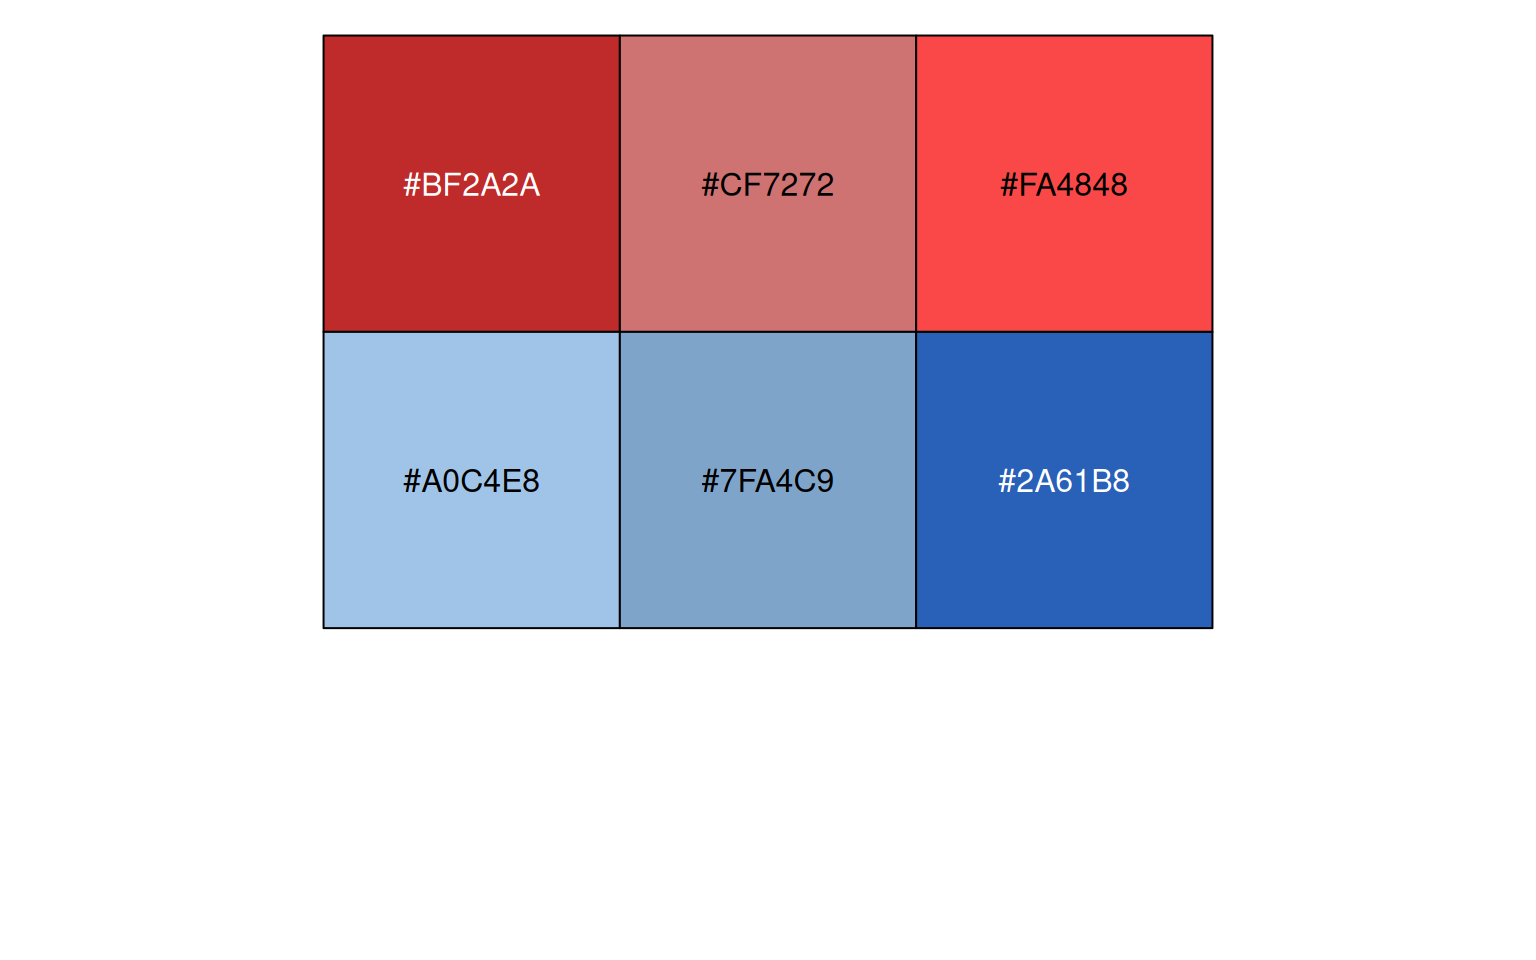
show_col(mengbo_pal("wehi_full")(9))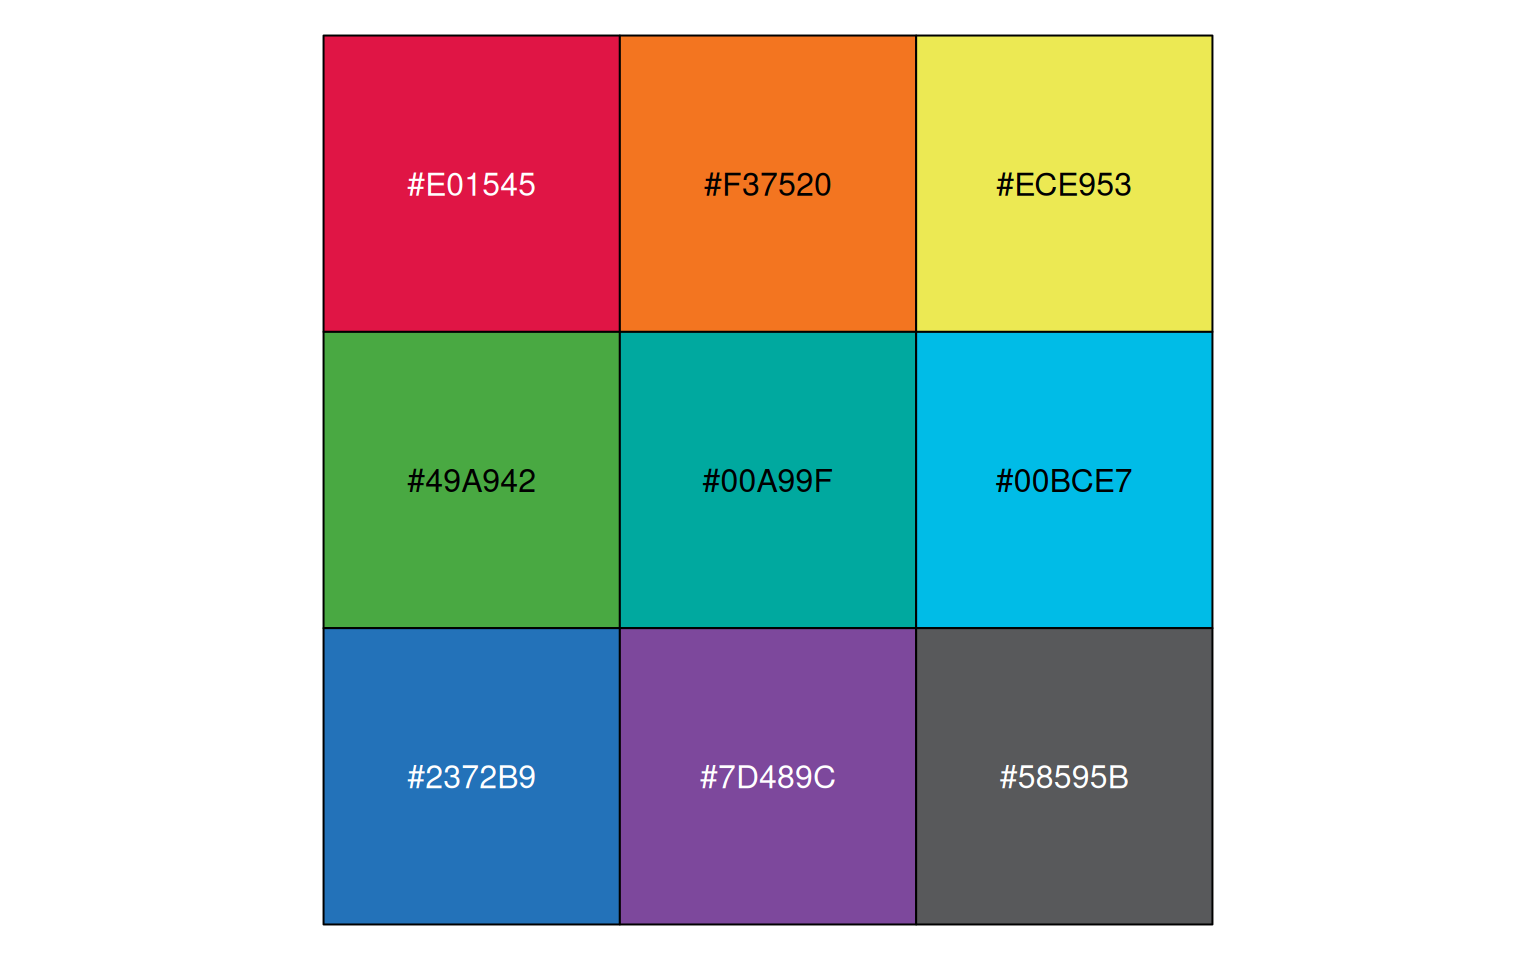
show_col(mengbo_pal("wehi_light")(8))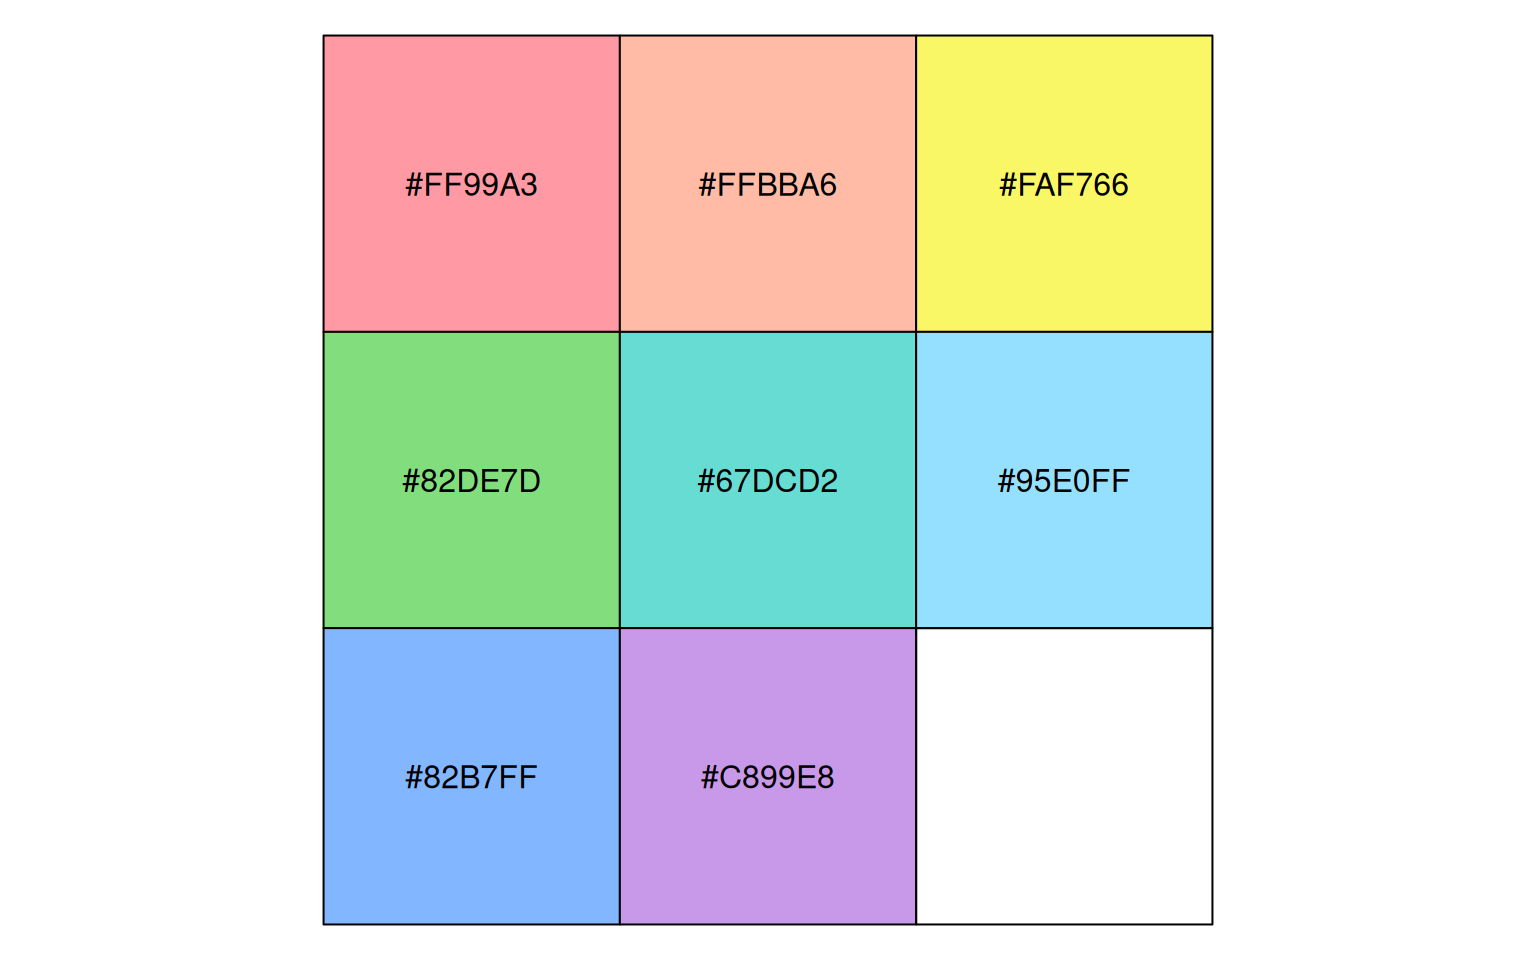
show_col(mengbo_pal("wehi_dark")(8))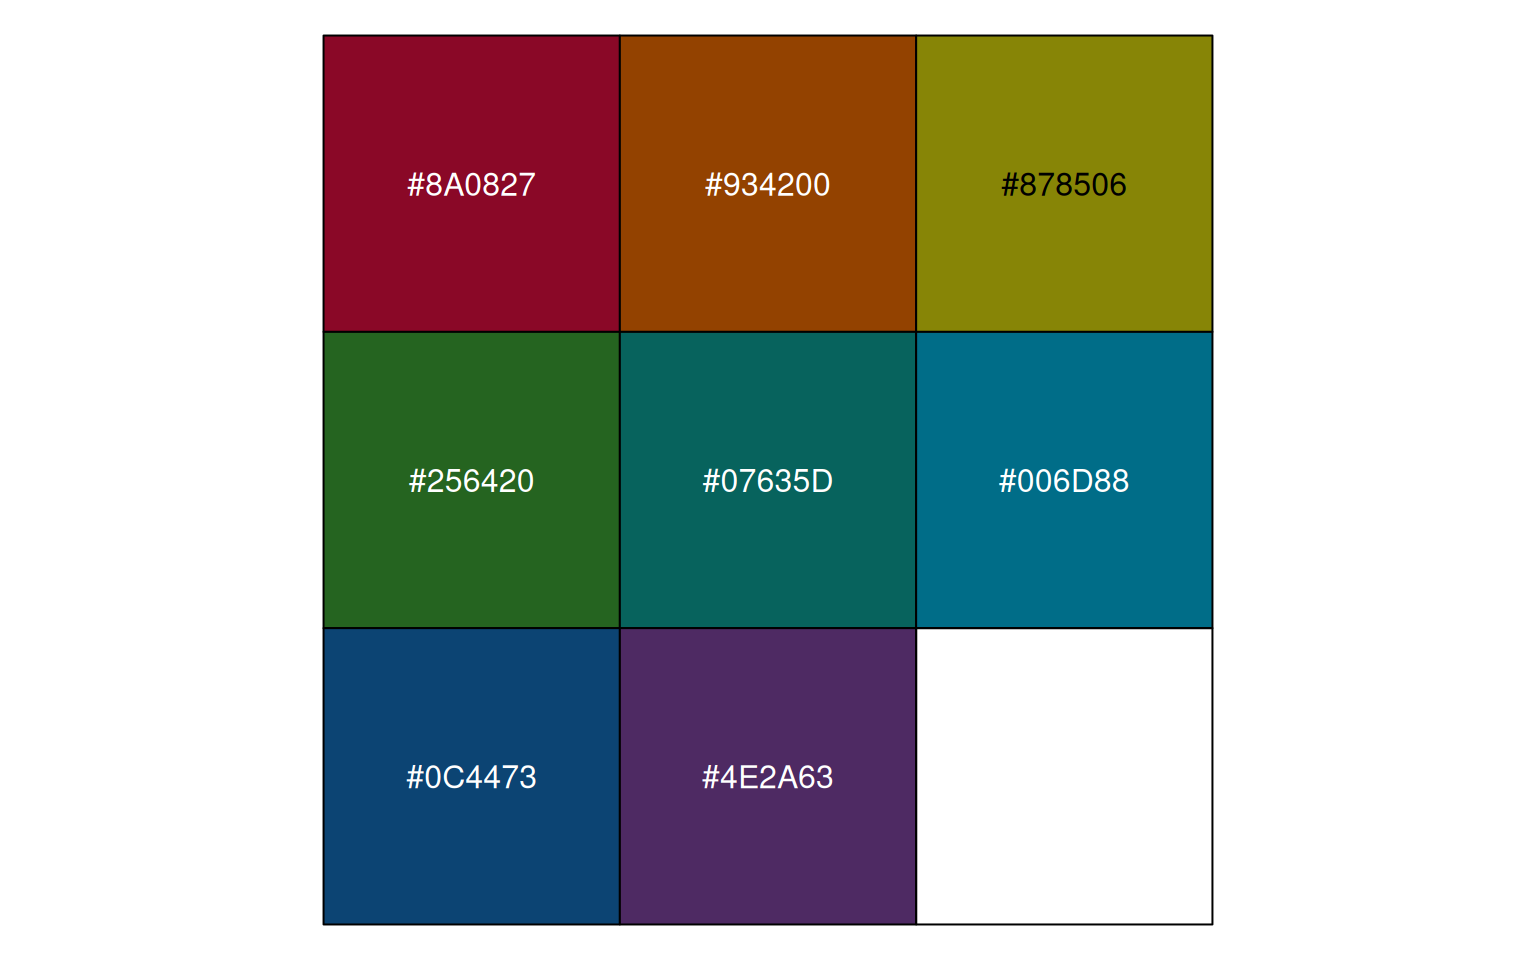
show_col(mengbo_pal("wehi_mix")(16))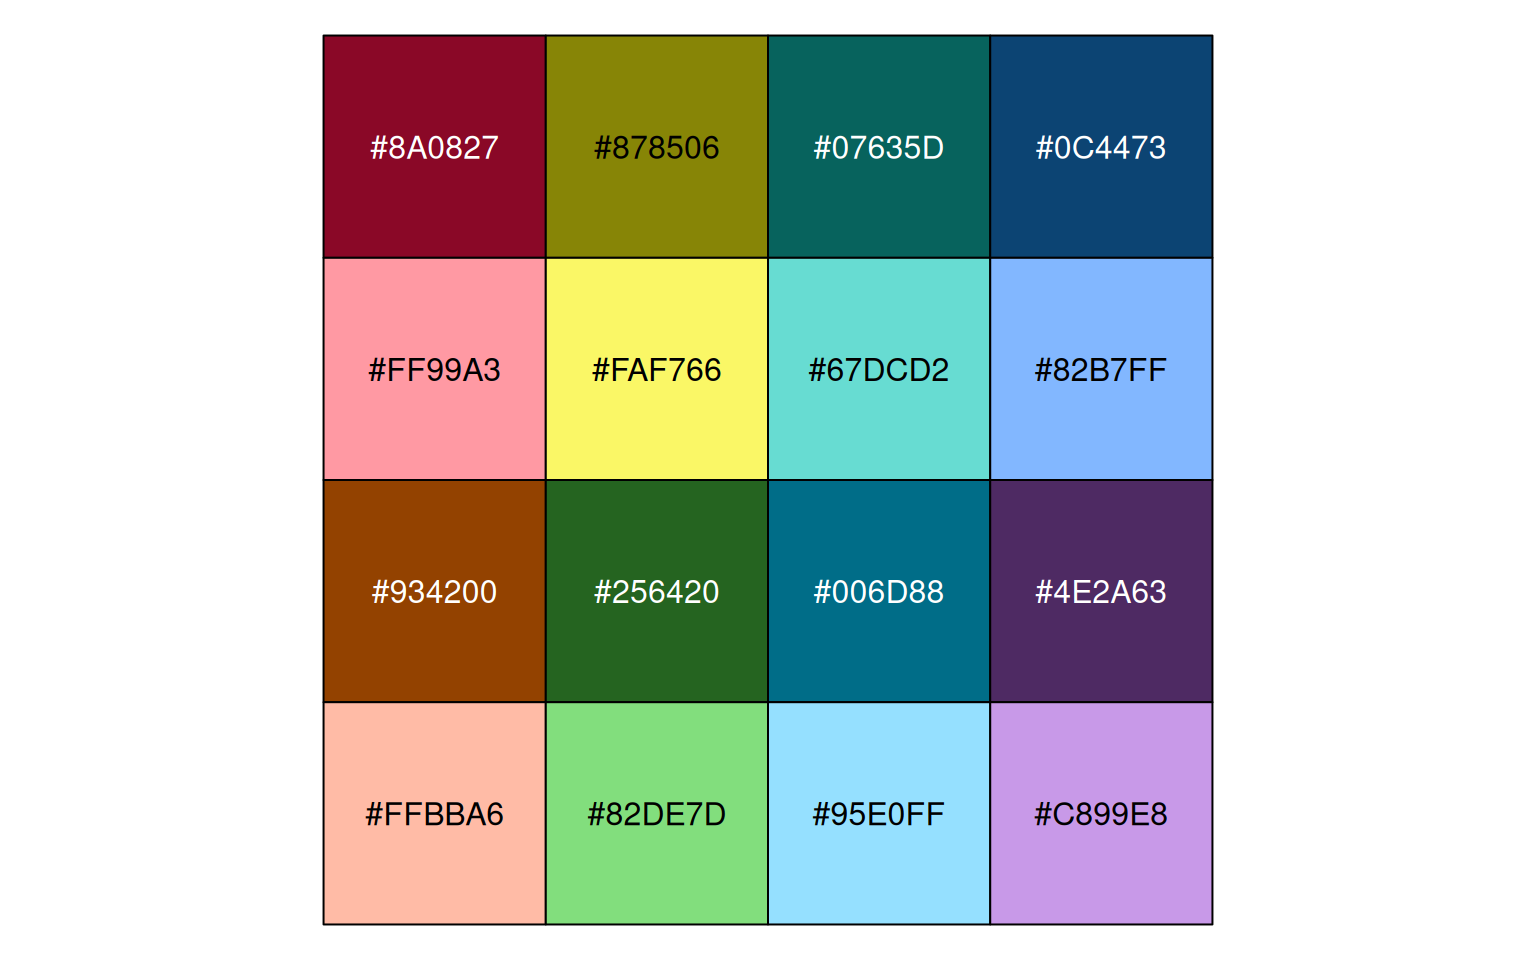
show_col(mengbo_pal("main")(16))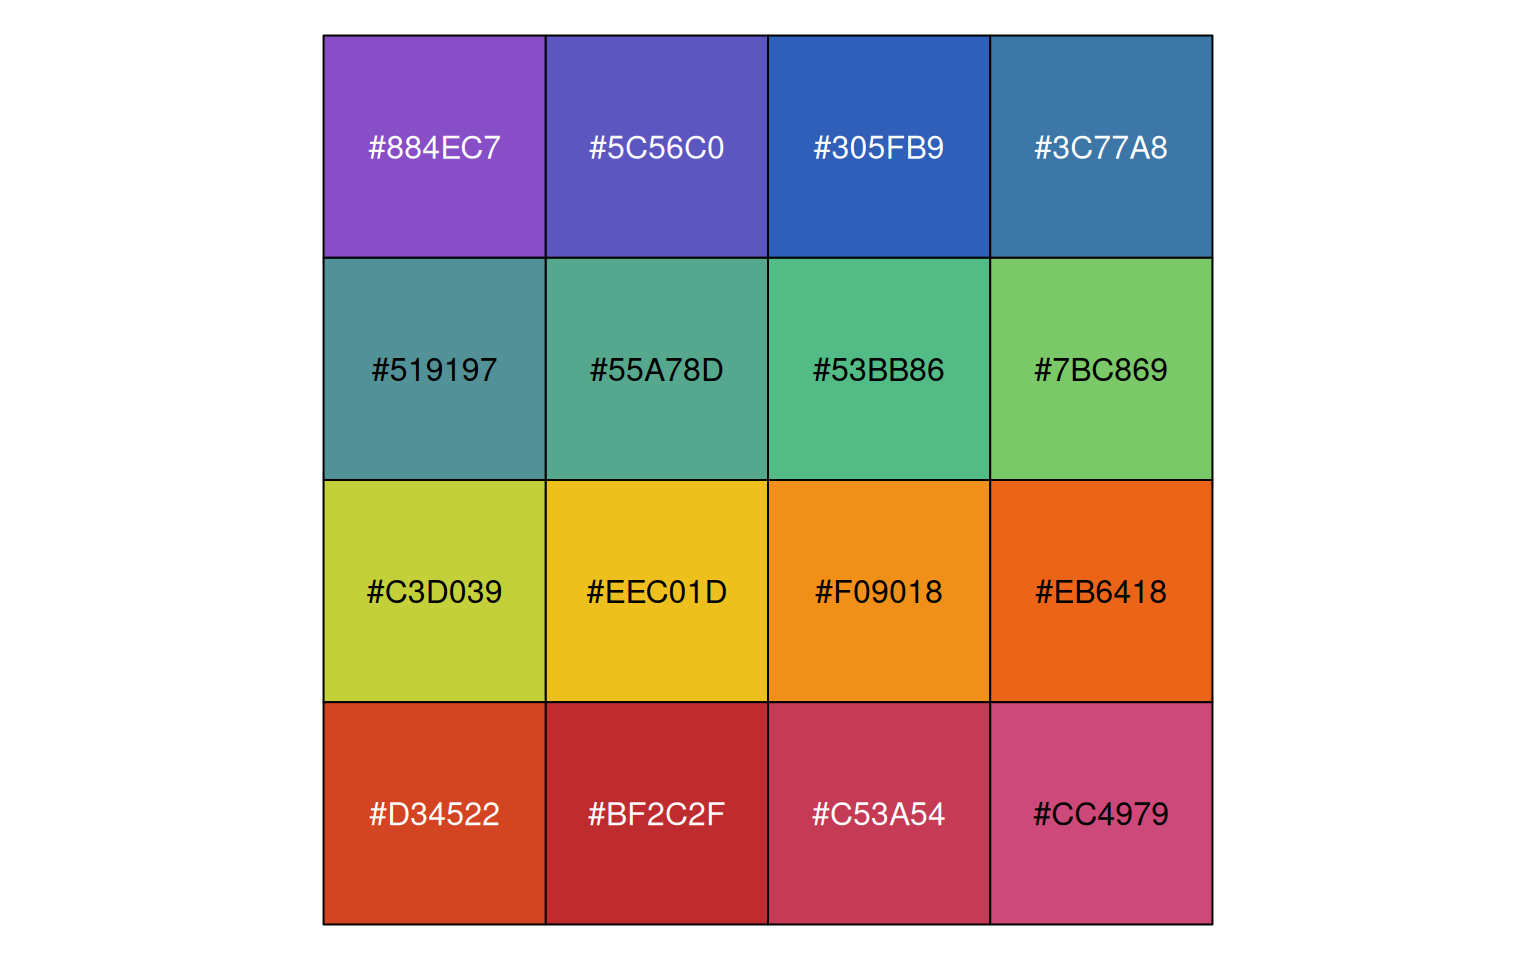
Discrete colour examples
My own ggplot theme modified based on the default ggplot theme
(theme_grey()). Modifications include removing the minor
grids, bigger axis texts, empty panel and legend background and so
on.
Default
mtcars2 <- within(mtcars, {
  vs <- factor(vs, labels = c("V-shaped", "Straight"))
  am <- factor(am, labels = c("Automatic", "Manual"))
  cyl  <- factor(cyl)
  gear <- factor(gear)
})

p1 <- ggplot(mtcars2) +
  geom_point(aes(x = wt, y = mpg, colour = gear)) +
  labs(
    title = "Fuel economy declines as weight increases",
    subtitle = "(1973-74)",
    caption = "Data from the 1974 Motor Trend US magazine.",
    tag = "Figure 1",
    x = "Weight (1000 lbs)",
    y = "Fuel economy (mpg)",
    colour = "Gears"
  )
p1 + theme_mengbo()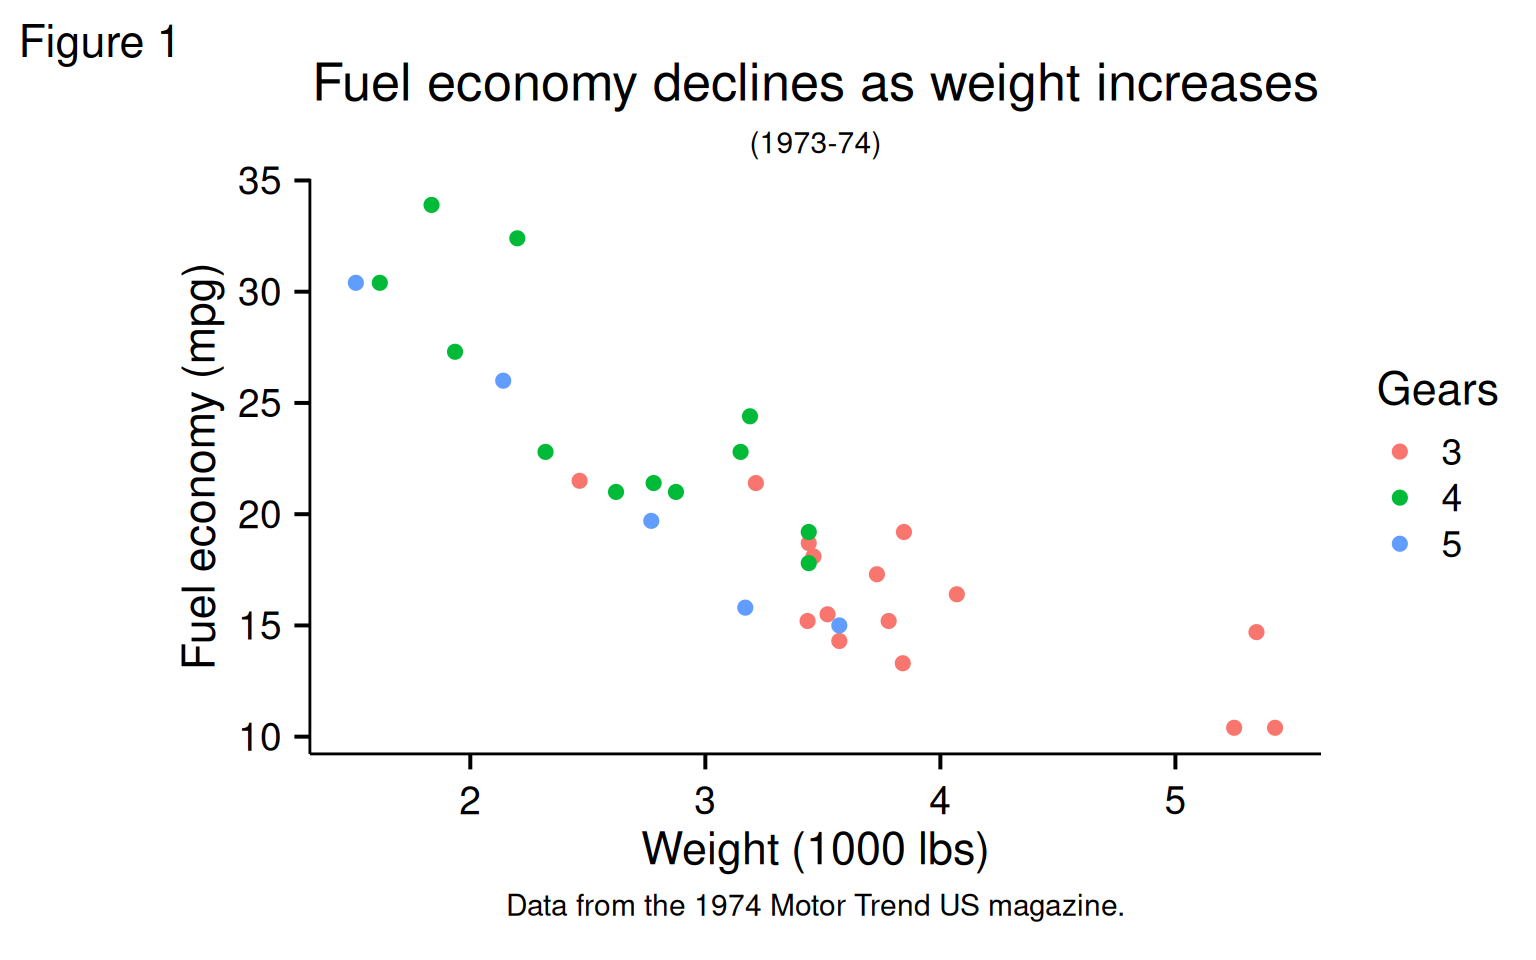
p1 + facet_wrap(~ gear) + theme_mengbo()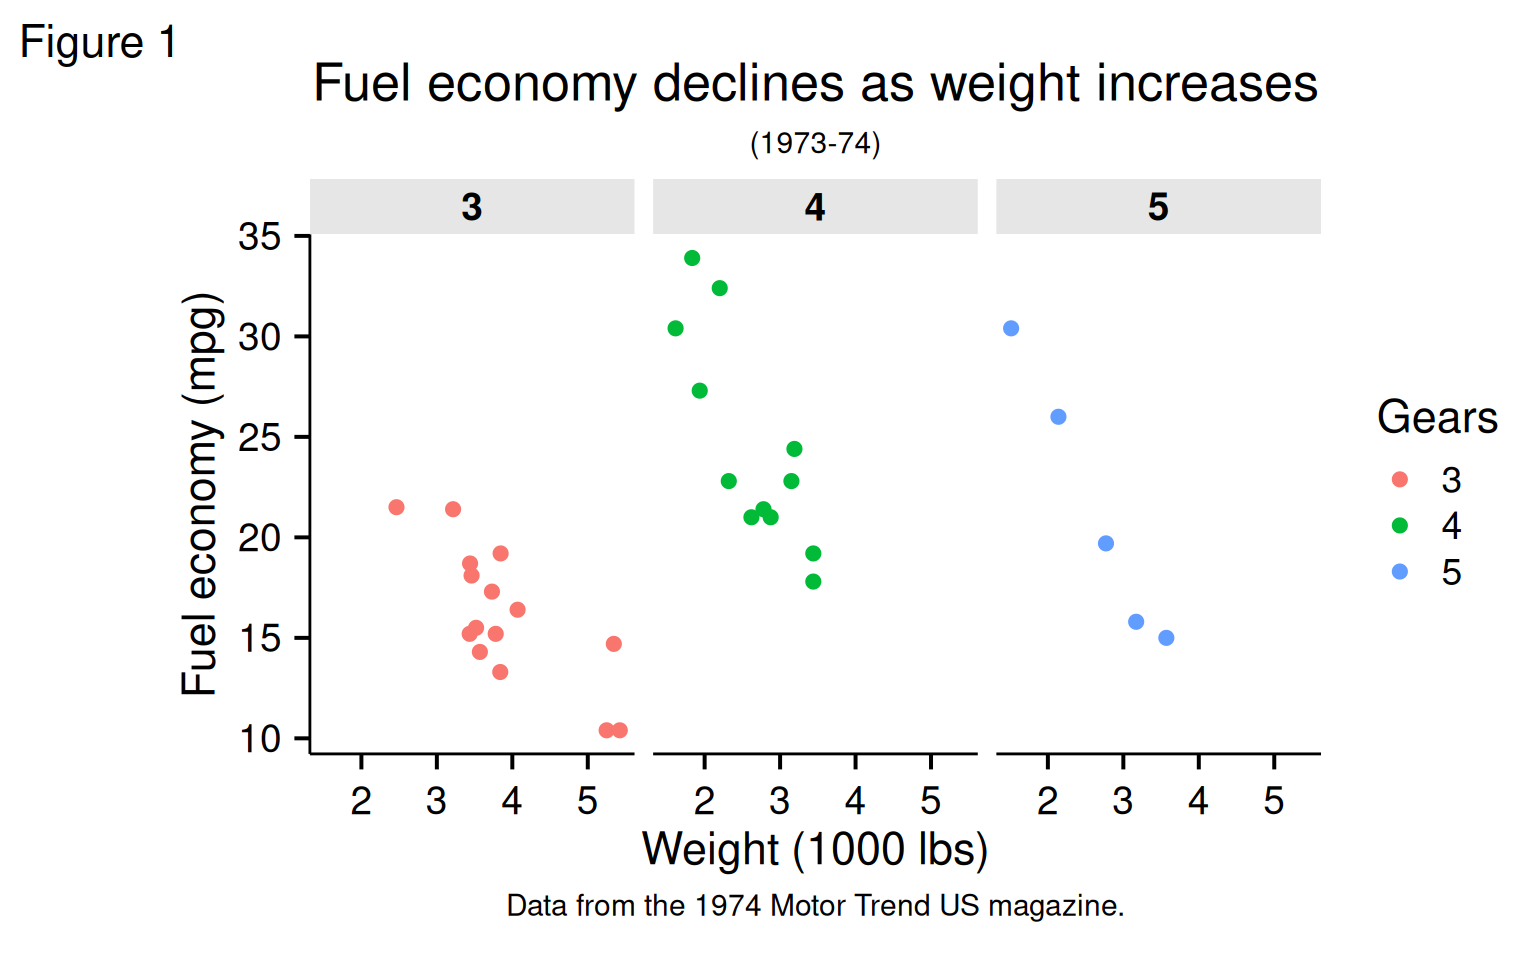
With my colour palettes:
p1 + scale_color_mengbo("main") + theme_mengbo()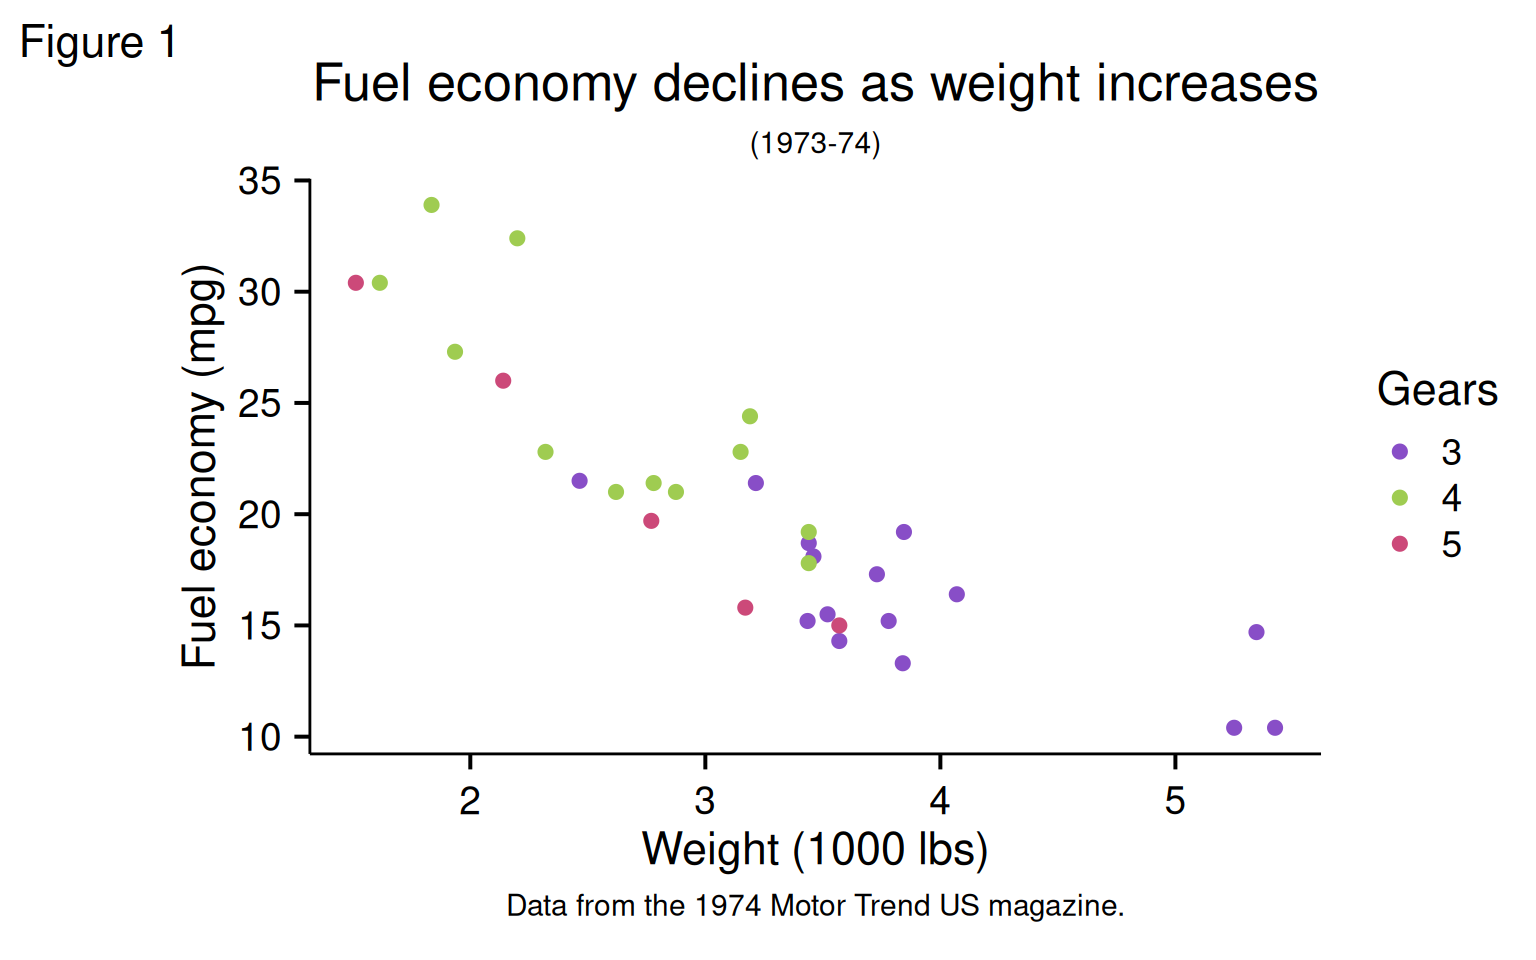
Framed figure panel
p1 + theme_mengbo(clean_background = FALSE)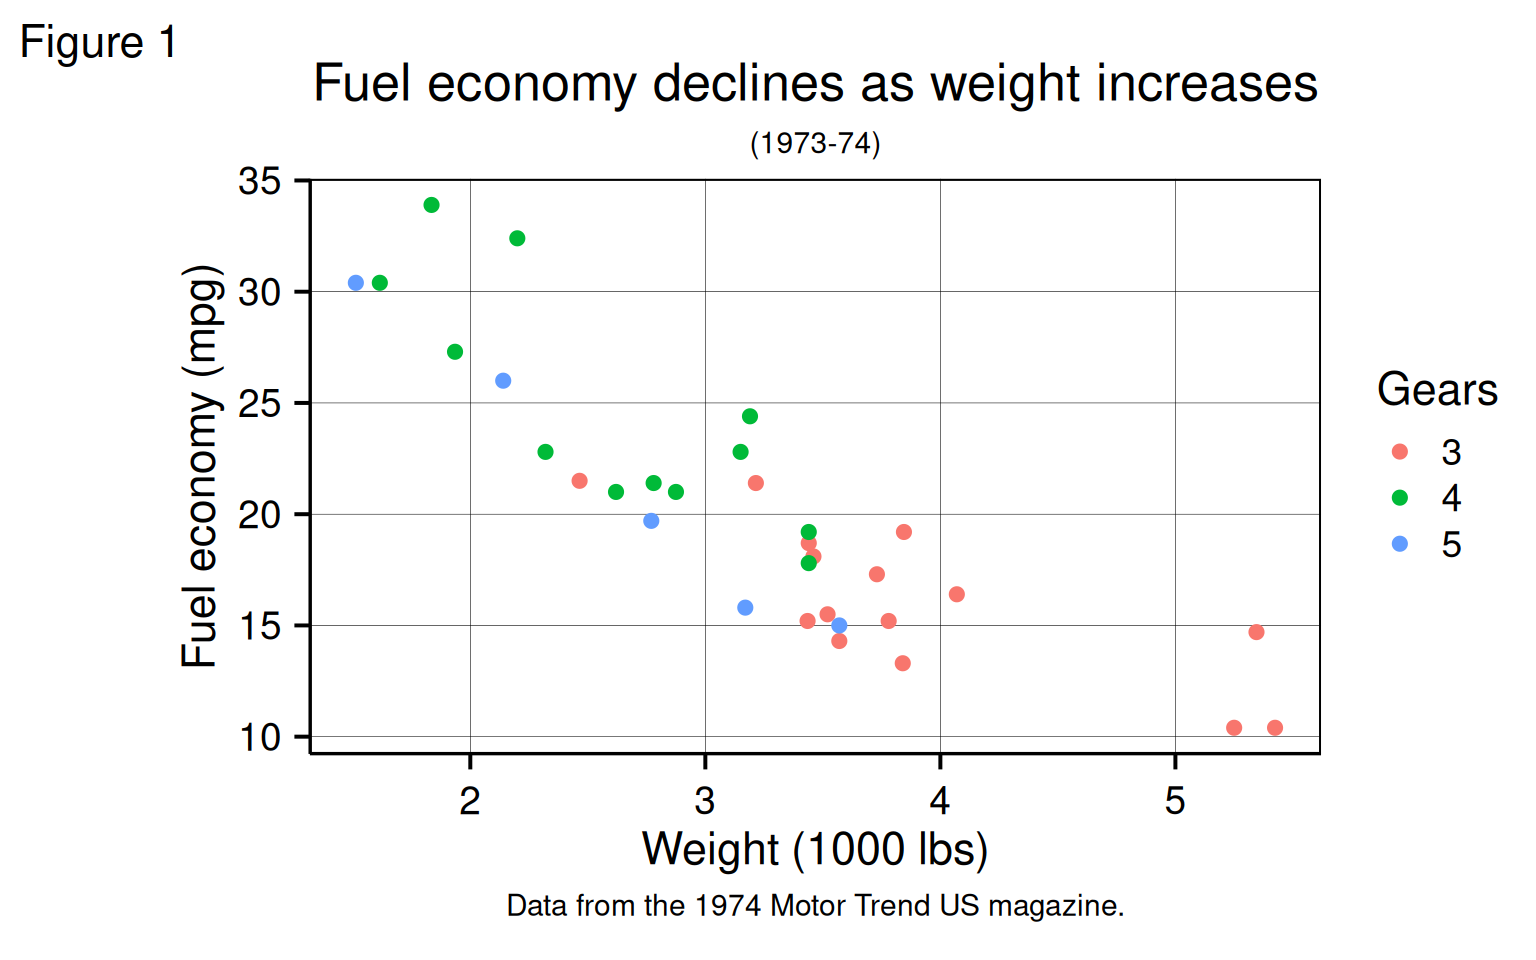
p1 + facet_wrap(~ gear) + theme_mengbo(clean_background = FALSE)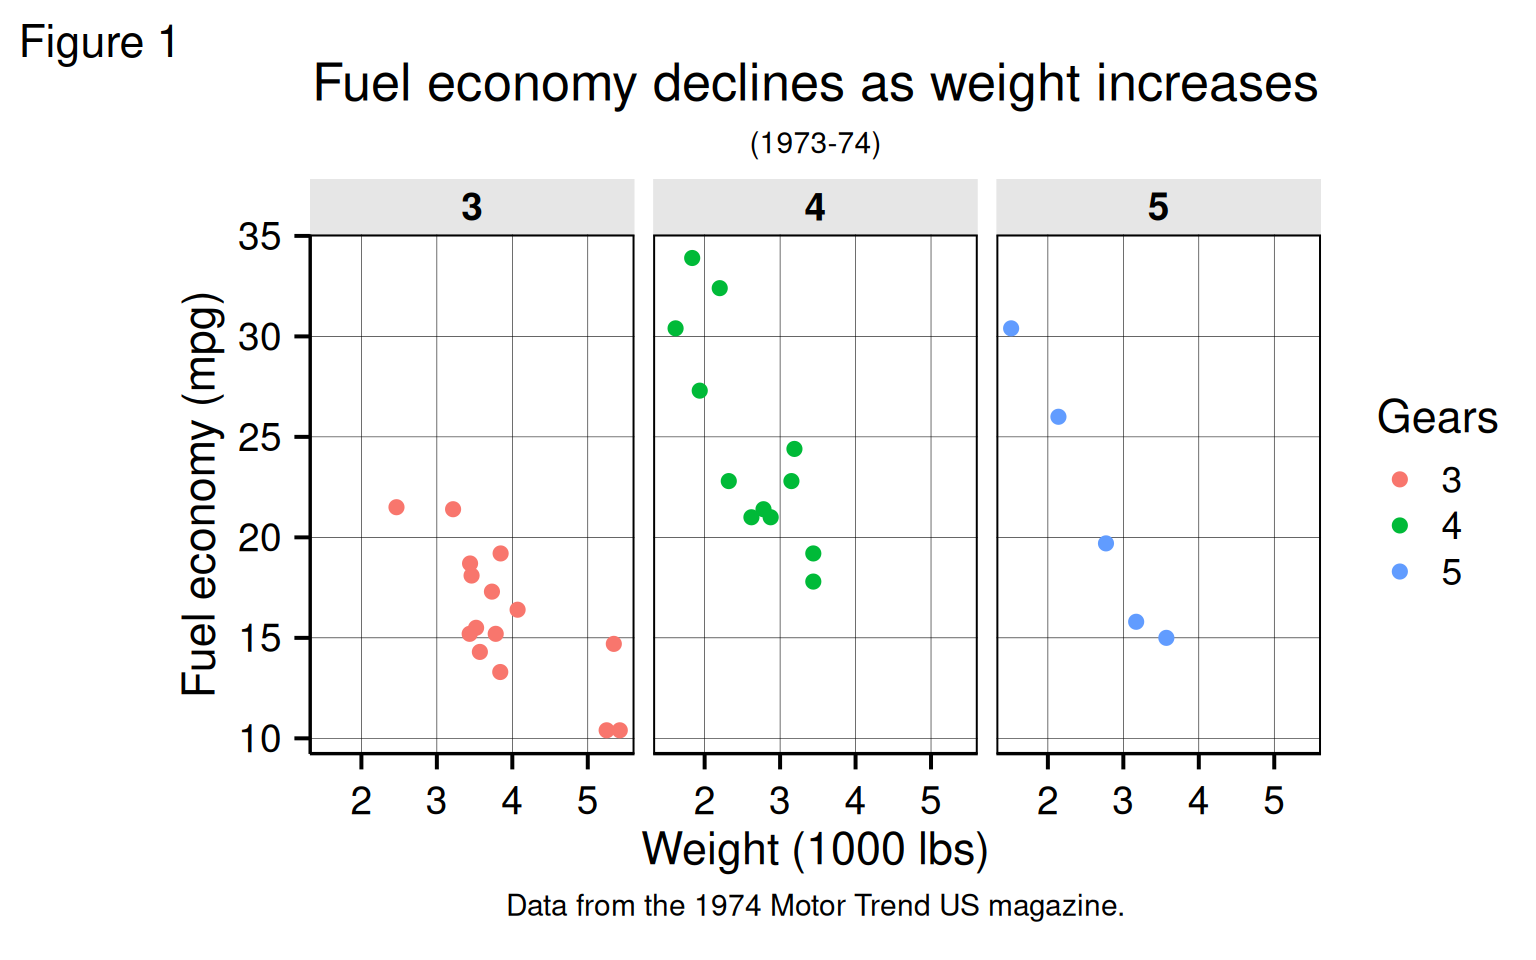
Continuous colour examples
ggplot(iris, aes(Sepal.Width, Sepal.Length, color = Sepal.Length)) +
  geom_point(size = 4) +
  scale_color_mengbo("main", discrete = FALSE) +
  theme_mengbo()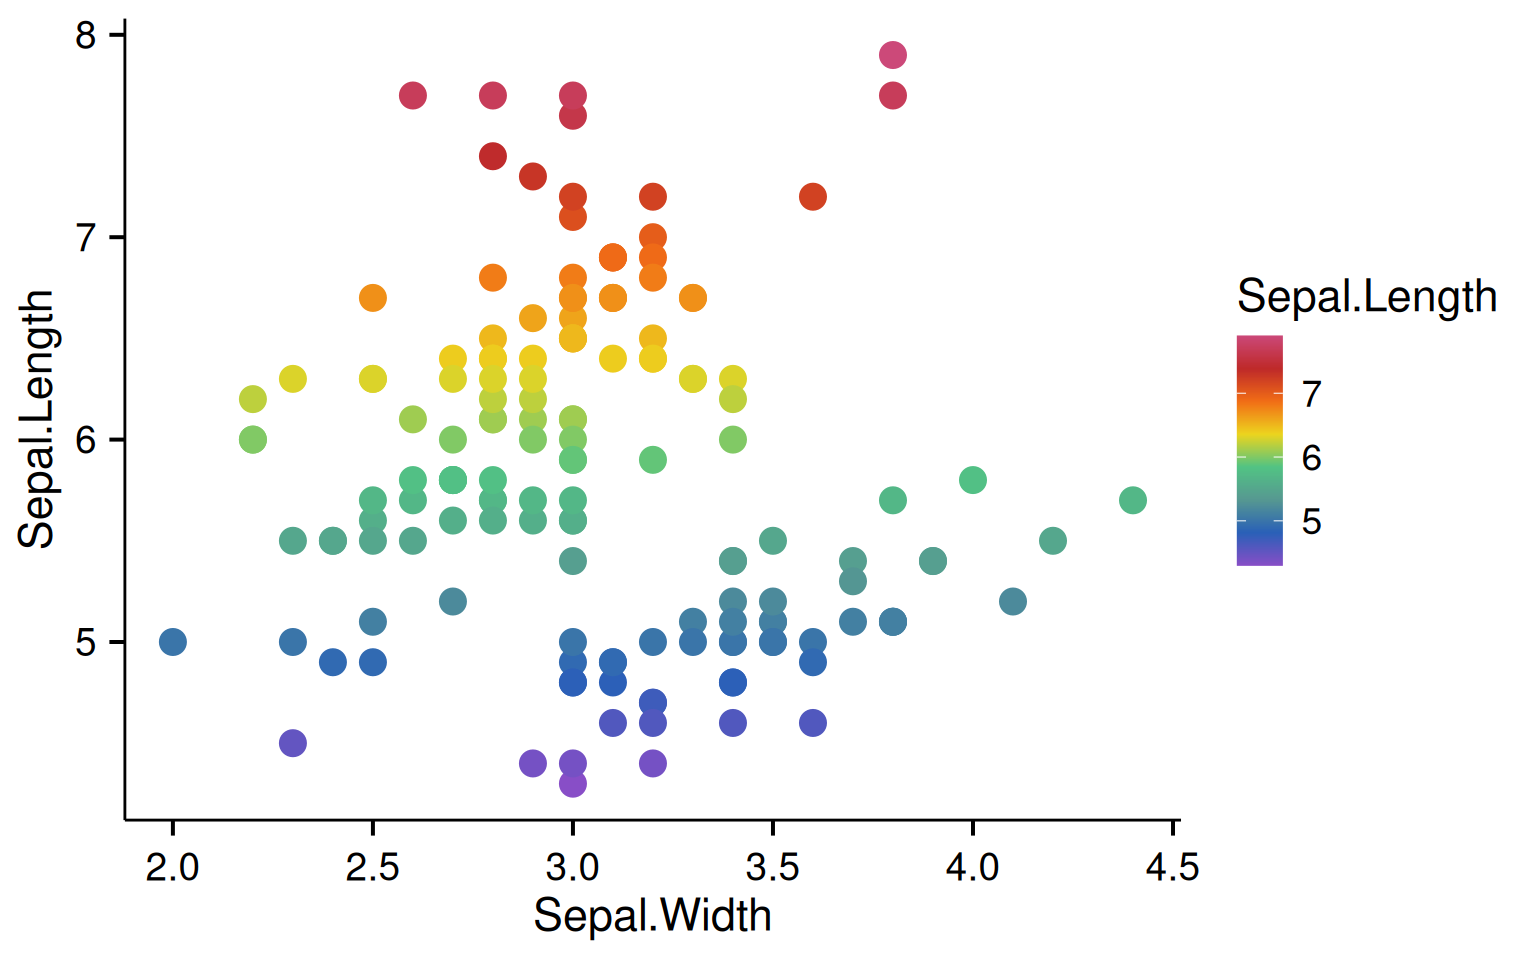
Session information
sessionInfo()
R version 4.5.1 (2025-06-13)
Platform: x86_64-pc-linux-gnu
Running under: Ubuntu 24.04.3 LTS

Matrix products: default
BLAS:   /usr/lib/x86_64-linux-gnu/openblas-pthread/libblas.so.3
LAPACK: /usr/lib/x86_64-linux-gnu/openblas-pthread/libopenblasp-r0.3.26.so;  LAPACK version 3.12.0

locale:
 [1] LC_CTYPE=C.UTF-8       LC_NUMERIC=C           LC_TIME=C.UTF-8        LC_COLLATE=C.UTF-8
 [5] LC_MONETARY=C.UTF-8    LC_MESSAGES=C.UTF-8    LC_PAPER=C.UTF-8       LC_NAME=C
 [9] LC_ADDRESS=C           LC_TELEPHONE=C         LC_MEASUREMENT=C.UTF-8 LC_IDENTIFICATION=C

time zone: UTC
tzcode source: system (glibc)

attached base packages:
[1] stats     graphics  grDevices utils     datasets  methods   base

other attached packages:
[1] scales_1.4.0     ggthemeML_1.0.1  colorspace_2.1-2 ggplot2_4.0.0    BiocStyle_2.36.0

loaded via a namespace (and not attached):
 [1] vctrs_0.6.5         cli_3.6.5           knitr_1.50          rlang_1.1.6
 [5] xfun_0.53           S7_0.2.0            textshaping_1.0.3   jsonlite_2.0.0
 [9] labeling_0.4.3      glue_1.8.0          htmltools_0.5.8.1   ragg_1.5.0
[13] sass_0.4.10         rmarkdown_2.30      grid_4.5.1          evaluate_1.0.5
[17] jquerylib_0.1.4     fastmap_1.2.0       yaml_2.3.10         lifecycle_1.0.4
[21] bookdown_0.45       BiocManager_1.30.26 compiler_4.5.1      RColorBrewer_1.1-3
[25] fs_1.6.6            farver_2.1.2        systemfonts_1.3.1   digest_0.6.37
[29] R6_2.6.1            pillar_1.11.1       bslib_0.9.0         withr_3.0.2
[33] tools_4.5.1         gtable_0.3.6        pkgdown_2.1.3       cachem_1.1.0
[37] desc_1.4.3